At Testify, we have developed a modular system that enables you to digitally control, document and analyze all types of mobile testing and quality processes.
In this article, we take a closer look at the “Checklist analysis reporting” feature.
General introduction to Testify Reporting incl. dashboards.
Each Testify report contains different dashboards in which your data is presented in a structured way. You can select exactly the reporting packages you need for your company from a wide range of themed reporting packages.
The general structure of a dashboard is as follows:

You will always find the key performance indicators (KPIs) in the top right-hand corner. The data is presented visually in a central position. These are displayed differently depending on the report.
There is always a filter on the left-hand side that allows you to display only the data that meets certain criteria. And at the bottom of the dashboards, all the data is displayed in a table.
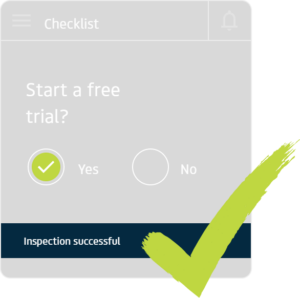
Checklist analysis Reporting.
Checklist analysis reporting gives you a comprehensive insight into the overall situation of the checklists in your company. The reporting package “Checklist Analysis Reporting” contains three dashboards. The following dashboards are included:
- Checklist overview
- Checklist details
- Defects in checklists


Filtering in reporting allows you to obtain targeted and more in-depth information depending on your request. You can easily analyze them over time according to the current status and frequency of use.
Dashboard: Checklist overview.
This dashboard is suitable for getting a general overview of the checklist situation in the company. You can see which checklists are used most frequently. Overdue checklists are also visible at a glance, which in turn gives you the opportunity to drive your processes forward.

KPIs
- Number of checklists
- Number of test objects
- Number of tests
- Overdue checklists
Visualizations
- Number of checklists over time: This shows the number of checklists carried out over time, which gives you a good insight into how the trend of checklists carried out is developing.
- Checklists by status: Using the ring diagram, you can see the current status of your checklists at a glance and thus assess the current situation and the need for action in your company.
- Checklists by frequency of use: By visualizing the number of checklists by frequency of use, frequently used checklists can be identified at a glance.
Dashboard: Checklist details.
This dashboard gives you a detailed insight into the individual check cases of a checklist and allows you to analyze both open and negative checks in more detail.
KPIs
- Number of test objects
- Number of tests
- Open exams
- Negative tests
Visualizations
- Number of checks over time: By visualizing the number of checks over time, you can not only see how many checks have been carried out over the period under review, but also how many of them are open, successful and negative.
- Checks by status: The visualization gives you a good overview of the distribution of the current status of your checks in the checklists. These are divided into open, successfully completed and negative check cases.
- Negative checks in % per checklist: To get a more accurate insight into your checklist results, checklists that have high negative checks in relation to the total checks are compared and sorted in descending order.
Dashboard: Defects in checklists.
This dashboard gives you an insight into all defects created within a checklist.

KPIs
- Number of checklists
- Number of defects
- Open defects
Visualizations
- Number of defects per checklist: The bar chart is sorted in descending order based on the number of defects in your checklists. Thanks to the dynamic operability, you can filter the checklist you want to view in more detail with a mouse click. Not only the KPIs, but also the other visuals and the table are adjusted according to your selection.
- Defects by status: The visualization of defects by status gives you a perfect overview to assess the current situation of your defects and any need for action in your company.
Conclusion.
In this article, we have gone into detail about our checklist analysis reporting, including the 3 integrated dashboards. These provide a comprehensive insight into the overall situation of the checklists in your company.
To find out more about Testify, please contact us.