
Wir haben bei Testify einen modularen Baukasten entwickelt, mit dem Sie in der Lage sind, alle Arten von Prüfprozessen digital zu steuern, zu dokumentieren und zu analysieren.
Diesen Monat dürfen wir Ihnen ein Key-Feature vorstellen, welches unseren Software Baukasten wesentlich erweitert.
Diesen Monat dürfen wir Ihnen eine wichtige Erweiterung des Reporting Modules vorstellen.
Detaillierte Qualitätsdaten vom Shopfloor, visuell aufbereitet.
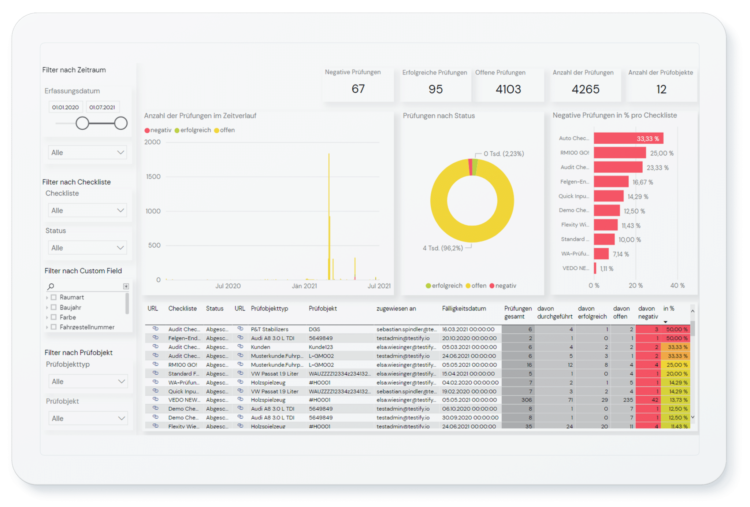
Checklisten-Analyse:
Mit der Checklisten-Analyse erhalten Sie einen Einblick über alle verwendeten Checklisten im Unternehmen. Die Filter erlauben Ihnen eine Analyse nach dem Zeitpunkt, Status, Häufigkeit der Verwendung und vieles mehr.
Checklisten-Prozess-Analyse:
Mit der Ansicht der Checklisten-Prozess-Analyse erhalten Sie einen detaillierten Überblick über Durchlaufzeiten, Compliance und Einhaltung der Prozesskonformität und der verschiedenen Prozessvarianten. Daraus können Sie auf einen Blick ablesen, wo Handlungsbedarf besteht.
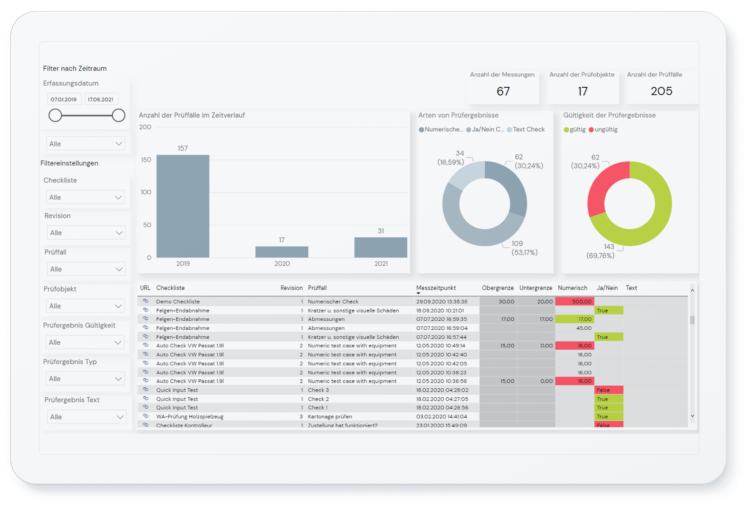
Check-Ergebnis-Analyse:
Mit Hilfe der Check-Ergebnis-Analysis, der integrierten Qualitätsregelkarte und statistischen Prozessregelkarte können Sie im Rahmen der Prozessanalyse oder Risikoanalyse Ihre digitalen Geschäftsprozesse über einen definierten Zeitraum überwachen. Die Regelkarte vergleicht die erfassten Daten und Qualitätsmerkmale aus dem Workflow mit dem definierten Sollwert. Auf diese Weise können Sie entscheiden, ob und in welchem Umfang Gegenmaßnahmen ergriffen werden müssen.

Mangel-Analyse:
Die Mangel-Analyse ermöglicht es Ihnen, detaillierte KPIs Ihrer Mängel und Abweichungen abzulesen. Es unterstützt bei der Identifizierung und Analyse der Mängel im Zeitverlauf, nach Mängelkategorien, Lösungszeit und vieles mehr. Damit können Sie fundierte Entscheidungen treffen und frühzeitig Gegenmaßnahmen zur langfristigen Prävention vermeiden.
Mangel-Prozess-Analyse:
Mit den Mangel-Prozess-Analyse Dashboards hingegen können Sie die entstandenen Defizite in Ihrem Unternehmen im Detail analysieren. Sie erhalten Einblick in die Durchlaufzeiten sowie die Prozesskonformität.
Mangel-Trend-Analyse:
Die Mangel-Trend-Analysen in Power BI unterstützen Sie dabei, Kursabweichungen und Ursachen von Mängels frühzeitig zu erkennen, den Produktionsfortschritt kontinuierlich zu überwachen und Ihrem Produktionsteam Feedback zum Leistungsfortschritt zu geben. Mit dem Pareto- und Trend-Chart steht Ihnen ein Instrument zur Steuerung und Risikominimierung im Qualitätsmanagement zur Verfügung.
Die Daten werden in Testify übersichtlich mit Power BI visualisiert. Selbstverständlich können die Daten auch in Ihren Analyse-Tools aufbereitet werden.
Um mehr über Testify zu erfahren, kontaktieren Sie uns gerne.
Produkttour durch Testify.
In diesem Produkt Video erhalten Sie einen detaillierten Überblick über die wichtigsten Funktionen, vom Checklisten-Designer bis zu den integrierten Reportings.